If you’ve been studying complex systems you know what minor changes might cause consequences of much greater proportions, sometimes causing some effects that are not easily explained at first. I recently ran across a great illustration of such behavior while doing MySQL benchmarks which I thought would be interesting to share.
I’m using a very simple benchmark – Sysbench 0.5 on Percona Server 5.6.21-70.1 just running update queries:
sysbench --num-threads=64 --report-interval=10 --max-time=0 --max-requests=0 --rand-type=pareto --oltp-table-size=1000000000 --mysql-user=root --mysql-password= --mysql-db=sbinnodb --test=/usr/share/doc/sysbench/tests/db/update_index.lua run
Some people frown upon such benchmarks due to their triviality and being irrelevant to workloads. I like them because they often allow you to study already complex system behavior in a much more controlled environment than “real” workloads – and so you can understand internal dynamics better.
For this test I set innodb_purge_threads=8, innodb_max_purge_lag=1000000, innodb_max_purge_lag_delay=5000 as otherwise chances are that the history will just be growing forever not allowing the system to reach the steady state. I wrote about InnoDB history problems in detail recently in a post titled “InnoDB transaction history often hides dangerous ‘debt’.
The only change I was looking for is changing innodb_flush_log_at_trx_commit from 1 to 2. I then went back to 1 a few hours later, after the system had reached the steady state. What I would normally expect in such a case is a performance increase because there is less work to do on commit and that is pretty much it. Looking at the graphs however I can see much more changes in the system. Let me go through them and explain the ones which I can:

The throughput graph is probably the most interesting here. We can see that indeed the throughput has substantially improved when set innodb_flush_log_at_trx_commit=2 and then went back to the old one after it was set back to 1. We see however in 2 some interesting effects here – a spike of a few minutes and later a dip below the original performance level for a few hours, until finally recovery back to the baseline. I’ll explain this with different graphs.

CPU usage is interesting, too. We can see there is user CPU increase correlating to the throughput increase but also a drastic IOWait increase. Why would it increase when we’re actually making workload less IO bound by not flushing log as much? The reason is because there are more threads now that can perform IO concurrently, hence increasing what is reporting IO wait and deceasing idle time.

InnoDB writing much more data is expected and it very well matches throughput. Not much of anything unexpected.

As we see setting innodb_flush_log_at_trx_commit=2 causes the amount of dirty pages in the buffer pool to go down significantly. It recovers when it is put back. The reason I suspect in this case is the undo space – as we will see in later graph history length spikes quickly – obviously requiring some space in the buffer pool.
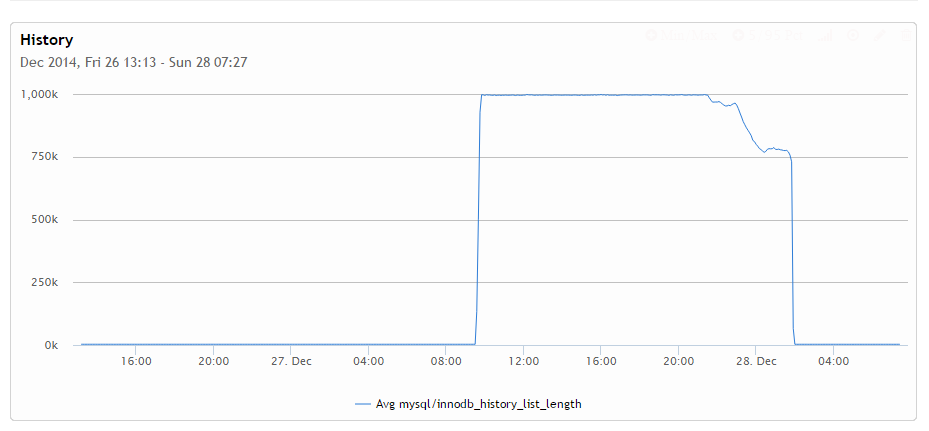
This is perhaps one of the most interesting graphs here. You can see for some reason when log flush is enabled that purge threads are able to keep up. But if you disable it they cannot, which makes history grow very quickly until the max allowed amount. This is by the way the time we see the spike in the throughput as there is no throttling being done to keep history in check. This also explains why after I set innodb_flush_log_at_trx_commit back to 1 that performance first drops well below original levels – InnoDB needs to go through and purge the history, which takes resources. Another interesting thing you can notice is how uneven history cleanup is. Specifically you can note some 75% percent of the history has been cleaned up almost instantly while initial 25% took a lot of time to work out. I do not have an exact explanation here yet I believe it has to do with the fact initially history purging requires a significant amount of IO while at a certain point in time a purge happens completely in the buffer pool and hence being much faster.
Why would purge threads have a hard time keeping up when log flush is disabled? I suspect there are 2 reasons. First, the system can provide much more throughput in such configuration (not keeping purging into account) while purge subsystem is limited and can’t keep up with such a high load. The other reason is – eliminating serialization on the log flush exposes other parts of InnoDB to contention which further suppresses purge system progress.

This is another relevant graph to show the throttling done because purging can’t keep up. As you see we got about 2.5ms delay injected for updates to give purging some time to keep up. It is good to watch it to understand if the max delay you specified is enough to prevent purge lag while still avoid having the system grind to a halt. Had I set innodb_max_purge_lag_delay to 1000 it would not be enough to prevent history length growing to infinity, having I set it to 100000 the system could grind to a halt in case there is some long-running transaction causing history length to grow to about 1 million.

Lets look at Physical IO – it is also quite interesting. As you can see in the first and last parts of the graph there are more pages flushed than pages read, while when we disable log flushing we get much more reads than writes which only stops after history purging catch up is complete. I find this very interesting – this means that working with even modest history – 1M in this case causes a lot of IO – I assume because due to access pattern to the undo space it is constantly being washed out from the buffer pool. This graph is a very good illustration why large history might be a death spiral, as once it is there the system needs to do much more work.

This IO utilization graph might be a bit hard to understand but what it generally shows is that during the time the hard drive has been 100% utilized, there was still at least one outstanding IO to serve. However the concurrency was different with more average IO requests outstanding when we had log flushing disabled. This makes sense. We can also see it was highest when we enabled log flushing back but there was history to go through and catch up.

Changes to contention are very curious – we can see there is a lot more spin rounds and specifically shared lock spin rounds when we have log flush disabled. This is what I believe comes from less serialization on the log flushing causes a lot more internal contention.

It might not be very easy to see but this graph shows that innodb_row_lock_times spikes 1000x when log flushing is disabled. Why would that be? I suspect the reason is injected delay for purging. I also suspect the design of this throttling so it only is done when an actual change is attempted to be made, this is where update statement already holds some locks, which causes more row lock contention for other statements.

InnoDB has something called Server Activity count. As you can see from this graph it is not really a good indicator – for some reason it shows a lower value when the server was doing much more work. I do not understand other than this variable is incremented enough to explain it but find it curious.

LRU flushing also is drastically different between enabled and disabled log flushing. We get a lot more calls to search free pages and a lot more scans. I’m not sure why exactly this is happening but I think this has something to do with undo space caching which is constantly washed out from buffer pool which increased IO seems to indicate.

Finally lets look at perhaps the most counter-intuitive result – the amount of pending pwrites to the log file – we allowed to cache more log files in the OS cache but the amount of waits on writes to the log files actually increased? I’m not very sure why this is happening – perhaps there is a lot of IO pressure on OS so it does not delay writes to the log files for long time?

This is the same graph showing log fsyncs and log pwrites together. We can see when we set innodb_flush_log_at_trx_commit=2 that we see a lot more waits on pwrites, while less waits on fsync (which now should only be happening once per second or so). In general these two graphs tell me in some cases assuming log writes with innodb_flush_log_at_trx_commit=2 will be “free” because the operating system will instantly acknowledge them and put in the cache is not always correct.
Summary: The main point I’m looking to illustrate here is what changes you’re doing to the MySQL configuration (same can be said about your application OS configuration, hardware, etc.) can cause much larger changes to system behavior than you would guess. If you have the time it is good to validate whenever there are any other changes to system behavior beyond what you would think. If not at least keep an open mind and assume what any change, even a small one, can cause dramatic system behavior changes.
If you want to explore similar graphs check out Percona Cloud Tools – it’s easy to get going and allows you to build graphs like these absolutely free and perform a lot of in depth analyses. Now in free beta, Percona Cloud Tools is a hosted service providing access to query performance insights for all MySQL uses.
The post How small changes impact complex systems – MySQL example appeared first on MySQL Performance Blog.